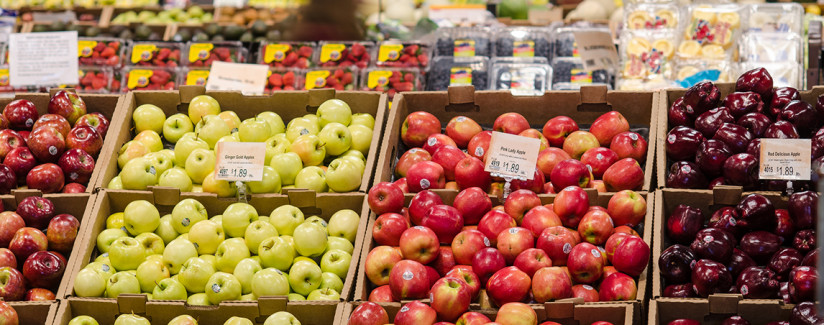
“Americans pay less for their food than consumers in any other country.”
Because the United States has such a large, affluent population, we spend more on food ($833 billion in 2007) than all other countries except China. But the average American spent only 6 percent of their money on food purchases, which is the lowest in the world.
While the average U.S. consumer spent $2,762 for food in 2007, which is one of the higher levels globally, only 9.8 percent of their disposable income was spent on food and beverage.
Because of inflation, a growing population, and increased consumption per person, the total amount Americans spend on food increases in most years. The last year total U.S. food expenditures were down was 1949.
True or Not? “Americans pay less for their food than consumers in any other country.”

Ronald Plain, PhD says:
Do Americans pay less for food than any other country? Although the numbers vary from one data set to another, and from year to year (depending somewhat on food prices but mostly on exchange rates), the answer depends not so much on the year of comparison or whose numbers are used, as on the precise meaning of the question. I present three alternatives.
Q1 Do Americans, in total, spend less on food than citizens of other countries?
No. Because the U.S. has a large and affluent population, in total, Americans spend more on food than all other countries except China. According to World Bank data, the U.S. spent $833 billion buying food in 2007, far more than the $11.6 billion spent in 2007 by the 4.5 million residents of Singapore, for example. China spent slightly over $1 trillion on food in 2007 to feed their population of 1.3 billion people. The Japanese were third in total national expenditure on food spending $665 billion in 2007. Germany and France ranked fourth and fifth, respectively.
Source: 1,2,3
Q2 Do Americans spend less per person on food than the citizens of other countries?
Yes and No. The average American spent $2762 for food in 2007, which is one of the higher levels in the world. For many people in poor countries, total expenditures for all items are lower than what Americans spend on food. For example, in 2007 the per capita income in Bangladesh averaged only $470. Americans did spend less per person buying food in 2007 than did residents of Japan ($5215), France ($4929), Germany ($3899), and the United Kingdom ($3090); but far more than residents of Morocco ($813), Philippines ($586), India ($299) and Vietnam ($278).
Source: 1,2,3
Q3 Do Americans spend a smaller percent of their income on food than citizens of other countries?
Yes. In 2007, only 6.0% of expenditures by the average American were to buy food. That is the lowest in the world according to the World Bank. By comparison, the French spent 12.7% and Russians 27.1% of their respective 2007 expenditures on food. As a general rule, the wealthier the nation, the smaller the share of income spent on food.
Food as portion of
Nation total expenditures
Nation Food as portion of total expenditures U.S.A. 6.0% United Kingdom 7.6% Singapore 7.8% Germany 10.0% France 12.7% Japan 13.8% Hungary 14.5% South Korea 14.6% Czech Republic 14.6% South Africa 19.0% Mexico 21.1% Chile 22.5% Turkey 23.3% Brazil 24.0% Colombia 24.9% Bulgaria 26.0% Russia 27.1% India 31.5% Romania 31.5% China 34.0% Morocco 35.3% Vietnam 36.1% Philippines 36.2% Ukraine 39.6% Indonesia 43.3% Source: World Bank, Euromonitor, 2008
A related question is: Are Americans spending more on food today than they did in the past? Again the precise meaning of the question is important. I offer four alternatives.
Q4 Are Americans spending more, in total, on food and beverages than in the past?
Yes. According to USDA, in 2007, Americans spent a record $997.3 billion on food and beverages. Because of inflation, a growing population, and increased consumption per person (just check people’s waistlines), total food expenditures by Americans increase in most years. The last year total U.S. food expenditures were down was 1949.
Source: USDA/ERS: Food CPI, Prices and Expenditures: Food Expenditures by Families and Individuals as a Share of Disposable Personal Income.
Q5 Are Americans spending more per person on food and beverages than in the past?
Yes. In 2007, the average American spent a record $3,310 on food and beverages. Because of inflation, food expenditures increase in most years. The last year U.S. per capita food expenditures were down was 1992.
Source: USDA/ERS: Food CPI, Prices and Expenditures: Food Expenditures by Families and Individuals as a Share of Disposable Personal Income.
Q6 Adjusted for inflation, are Americans spending more per person on food than in the past?
Yes. Even adjusted for inflation, U.S. per capita food expenditures are rising. The last year inflation adjusted U.S. per capita spending on food was less than the year before was 2000.
Source: USDA/ERS: Food CPI, Prices and Expenditures: Food Expenditures by Families and Individuals as a Share of Disposable Personal Income.
Q7 Are Americans spending a larger share of their disposable income on food than in the past?
No. In 2007, Americans spent 9.8% of their disposable income on food and beverages. It has been lower only once, 9.7% in 2004.
U.S. Food Expenditures as a Share of Disposable Income, 1929-2007
Year Percent | Year Percent | Year Percent 1929 23.4 1956 18.1 1983 12.5 1930 24.2 1957 18.4 1984 11.9 1931 23.0 1958 18.4 1985 11.7 1932 23.0 1959 17.8 1986 11.6 1933 25.2 1960 17.5 1987 11.5 1934 24.2 1961 17.1 1988 11.0 1935 23.4 1962 16.5 1989 10.9 1936 21.8 1963 16.0 1990 11.1 1937 21.5 1964 15.4 1991 11.2 1938 22.1 1965 15.1 1992 10.6 1939 21.3 1966 14.8 1993 10.8 1940 20.7 1967 14.1 1994 10.7 1941 19.4 1968 13.8 1995 10.6 1942 18.6 1969 13.7 1996 10.4 1943 18.6 1970 13.9 1997 10.4 1944 18.4 1971 13.4 1998 10.1 1945 19.2 1972 13.5 1999 10.2 1946 21.6 1973 13.3 2000 9.9 1947 23.5 1974 13.6 2001 9.9 1948 22.3 1975 13.8 2002 9.8 1949 22.1 1976 13.6 2003 9.8 1950 20.6 1977 13.4 2004 9.7 1951 20.9 1978 13.4 2005 9.8 1952 20.8 1979 13.4 2006 9.8 1953 19.9 1980 13.2 2007 9.8 1954 19.6 1981 13.0 1955 18.6 1982 12.6 Source: USDA/ERS: Food CPI, Prices and Expenditures: Food Expenditures by Families and Individuals as a Share of Disposable Personal Income.
Another question that often arises is: How do people in poor countries spend so little on food and survive? In part, they buy less food because they raise more of what they eat. In part, they eat less food per person. But much of the difference is in the type of food they buy. People in poor countries tend to eat out less, buy much less high cost foods such as meat, and buy much less prepared foods. Affluent people eat at restaurants. Poor people eat at home. Affluent people buy bread. Poor people buy flour.
Sources of Data
Population by country: World Development Indicators database, World Bank, revised 24 April 2009.
Per capita income by country: World Development Indicators database, World Bank, revised 24 April 2009.
Food expenditures as share of total expenditures by country: World Bank, Euromonitor, 2008
U.S. food expenditures by year: USDA/ERS: Food CPI, Prices and Expenditures: Food Expenditures by Families and Individuals as a Share of Disposable Personal Income.
Image: “110303_CNPP_LSC_0018” by U.S. Department of Agricultureis licensed under CC BY 2.0.


